Heatscape NYC
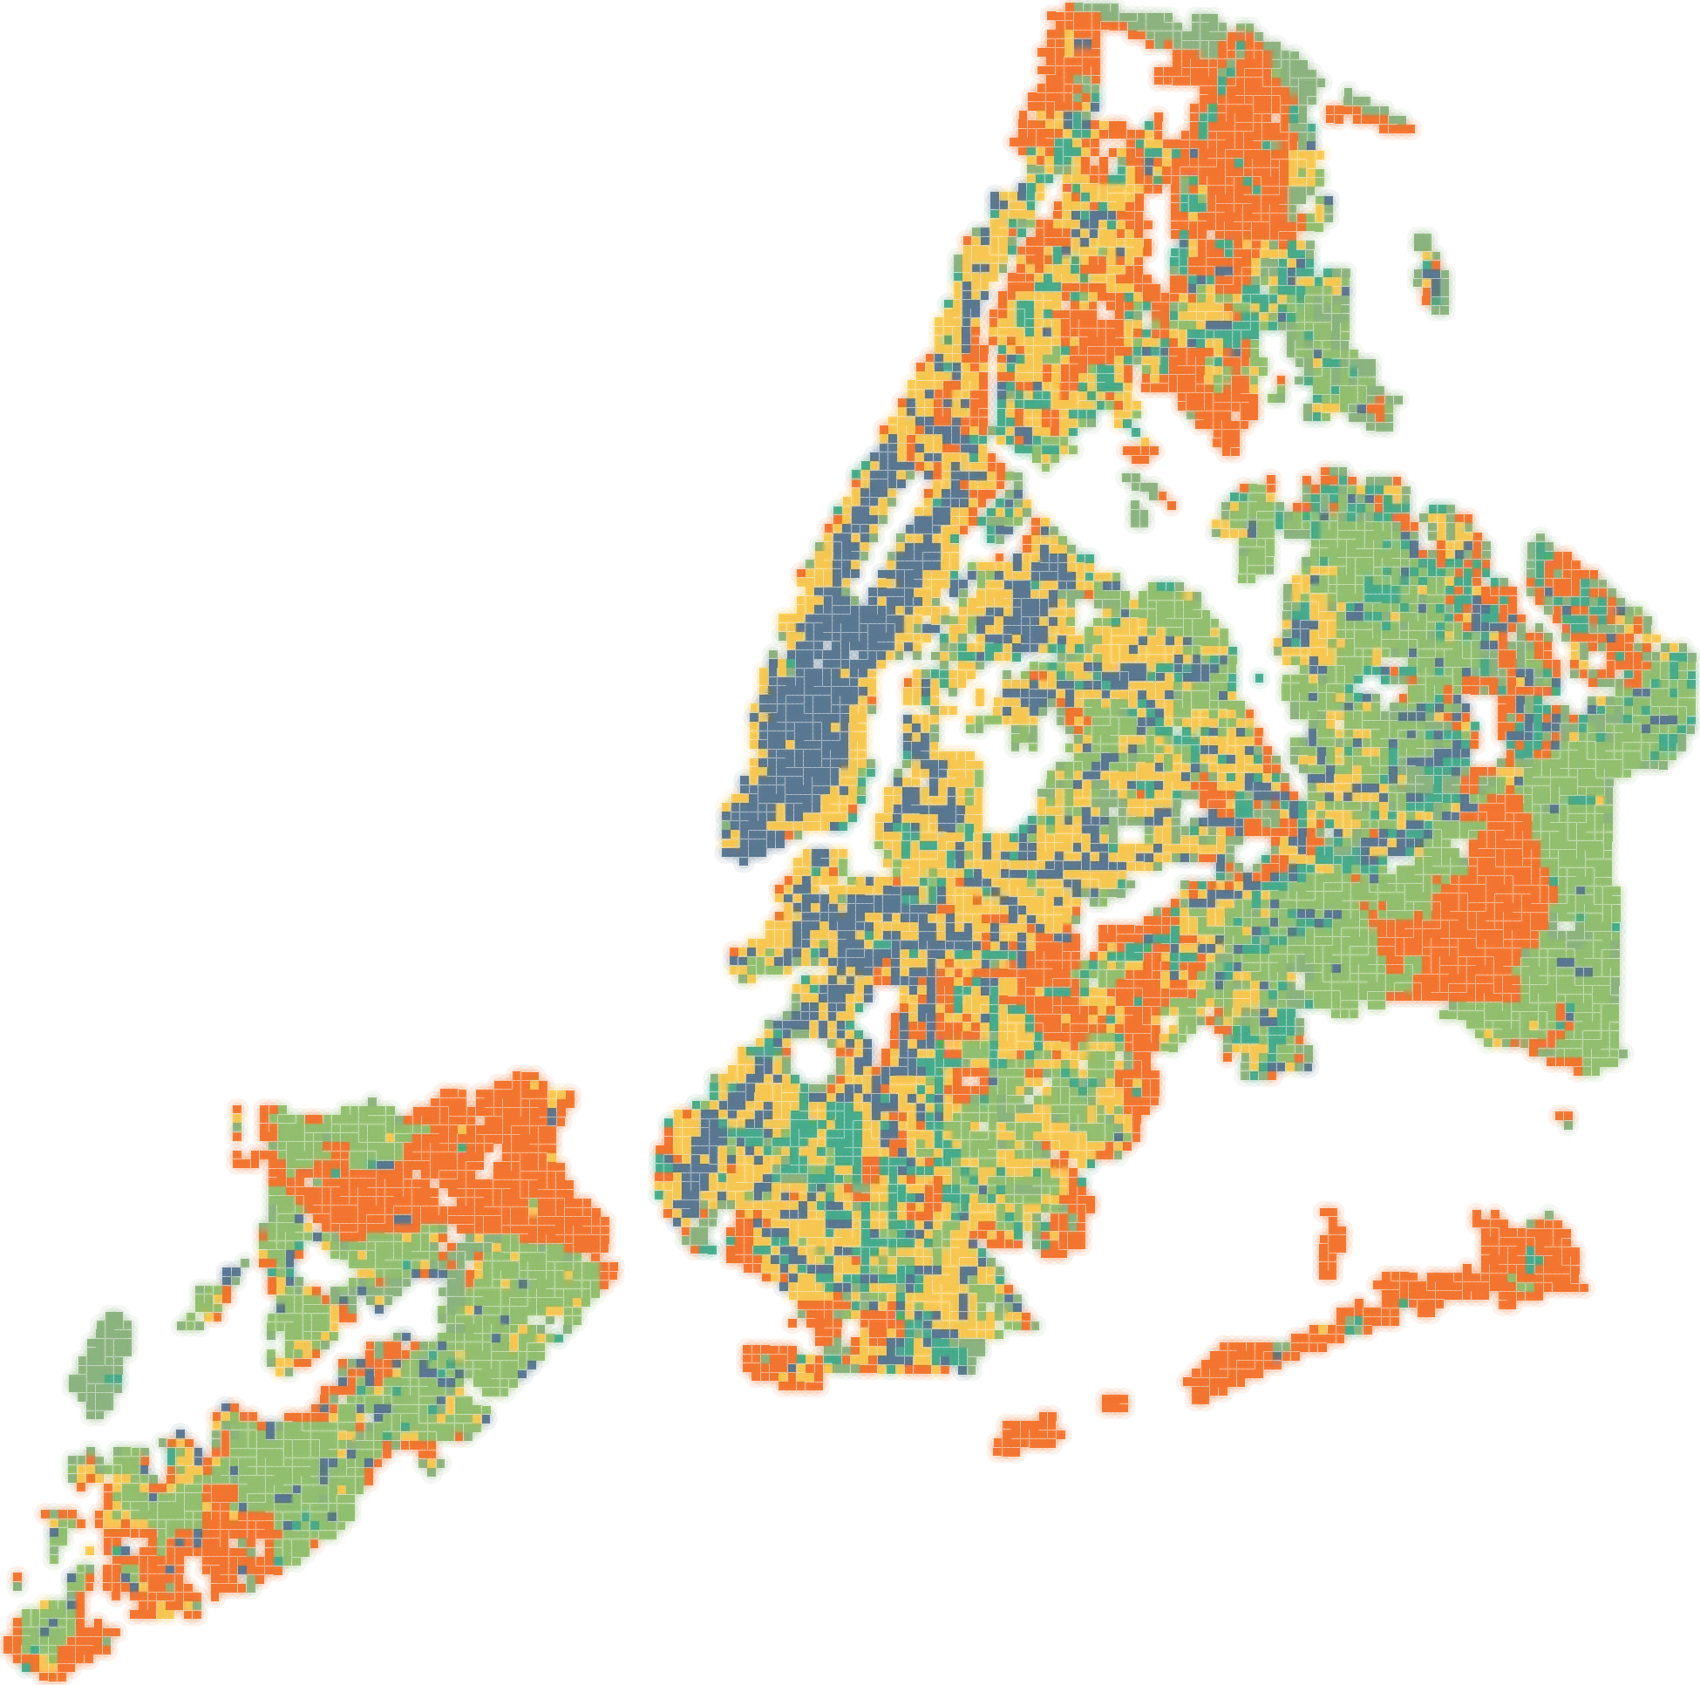
A 250-metre grid over New York City that scores every populated cell for heat risk across 43 indicators, then matches it to the cooling intervention its context actually supports — and shows the causal path it took to get there.
Applications, datasets and models built by the group. Each one is meant to be opened, not just cited.
A 250-metre grid over New York City that scores every populated cell for heat risk across 43 indicators, then matches it to the cooling intervention its context actually supports — and shows the causal path it took to get there.
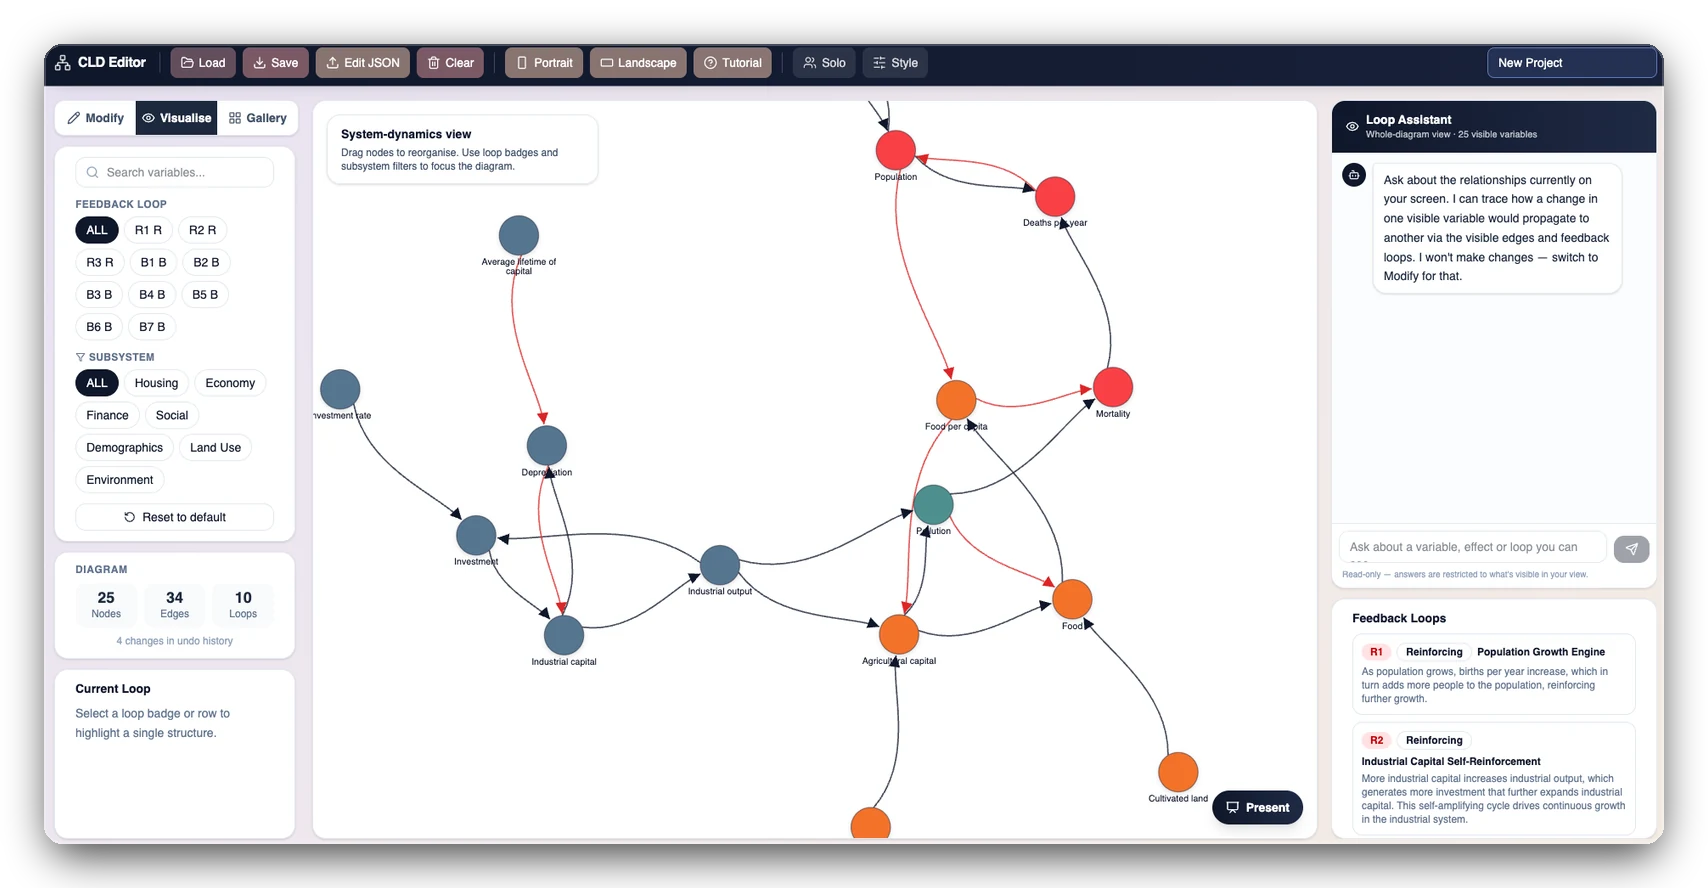
A browser-based platform for building and interrogating causal loop diagrams. It finds the reinforcing and balancing loops in a map for you, filters the structure by subsystem, and answers questions about what is currently on screen.
Workstreams
Four threads run in parallel underneath the shipped work. Each has a named lead and is where new projects come from.
Scalable, efficient infrastructure for visualisation, analytics and simulation — the substrate every other workstream builds on.
Machine learning and data analytics for high-resolution spatial understanding: flow prediction, anomaly detection, and inference of the patterns cities leave in their data.
Agentic tools, servers and knowledge infrastructure that let frontier models reason about places rather than just describe them.
Translating research into practice through municipal partnerships, pilot digital-twin deployments, and honest assessment of what changed in the planning decisions that followed.
Depending on interest, milestones can include developing your own app or AI project, presenting it to stakeholders, releasing a code package or dataset, or publishing.